Market Review – May 2023
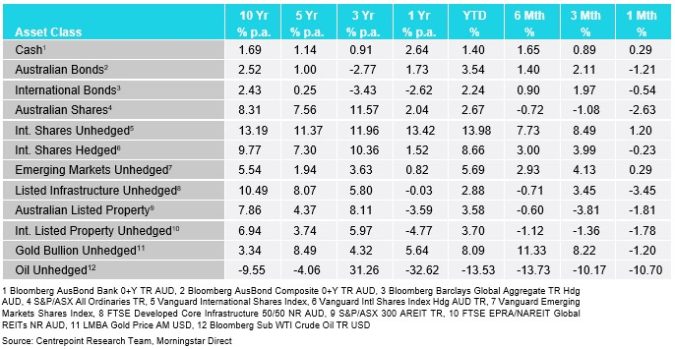
How the different asset classes have fared:
(As at 31 May 2023)

International Equities
In the month of May, the international stock performance demonstrated a distinct split between hedged and unhedged shares. Unhedged shares exhibited a return of 1.20%, a surprising positive outcome considering the overall sell-off of most asset classes in the same month, while hedged shares reported a -0.23% return.
This unexpected result in unhedged shares was primarily driven by the exceptional performance of a select few companies, notably the FAANG stocks – Meta Platforms (formerly Facebook), Amazon, Apple, Netflix, and Google. Despite the widespread economic uncertainty and increasing recession fears causing turbulence in the market, these US-based technology companies have offered some stability, acting as a sort of ‘safe haven’.
However, it’s worth noting that the broader S&P 500 hasn’t shown an overall positive trend this year. The mega-cap growth stocks have spurred a 33% rally in the NASDAQ due to strong earnings, an AI-driven frenzy, and the somewhat ability to weather a potential recession, propelling the S&P 500 to a gain of 11.54% Year-To-Date (YTD).
This phenomenon, where only a small cluster of stocks are propelling the overall market performance, is known as weak market breadth, which is typically not an encouraging sign.
On the global front, Japan, Germany, and Europe as a whole have emerged as the key outperforming markets YTD, showing gains of 20.81%, 15.28%, and 13.97%, respectively.
Australian Equities
Australian shares maintained their downward trajectory, persisting with disappointing performance over the last six months. During May, they further declined by 2.63%. This slump was primarily driven by underperforming sectors including financials, consumer staples, consumer discretionary, and materials, which collectively pulled the market downwards. Conversely, technology, real estate, and healthcare sectors exhibited positive performance during the month. Despite this, concerns surrounding a potential economic slowdown lingered, casting a shadow over investor and consumer sentiment.
Sectors with high economic sensitivity, such as financials and materials, have exhibited uninspiring performance over the past half-year. This is in stark contrast to the previous two years when these sectors were the driving force behind the Australian shares’ significant outperformance compared to international shares.
Domestic and International Fixed Income
In May, Australian bonds experienced a decline of 1.21%, while international bonds saw a drop of 0.54%. This was largely a consequence of a widespread increase in long-term interest rates throughout the month. Despite numerous economic indicators suggesting a substantial deceleration in economic activity, both the labour market and core inflation have displayed noteworthy resilience.
This resistance in core sectors has led to a rise in interest rates, as central bankers are persistently maintaining elevated rates. Notably, within the United States Federal Reserve, a shift in language has been observed. The Fed has signalled that their interest rate decisions will now hinge more heavily on “data-dependence,” indicating a potential end to their rate hiking cycle if the incoming data reflects sufficient weakness in the future.
Australian Dollar
In May, the Australian Dollar (AUD) faced further devaluation, recording a 2.6% decrease. This decline was primarily due to a combination of underperformance in the financial and materials sectors, coupled with a strengthening US Dollar (USD).
As we delve into 2023, the AUD continues to grapple with adversity, marking an overall drop of 4.6% year-to-date. One contributing factor is that Australia has been more hesitant in raising interest rates compared to the US. Consequently, those holding USD cash can secure higher interest rates than those with AUD cash, which naturally enhances the appeal of USD relative to AUD, thus leading to a further fall in the exchange rate.
Commodities – Gold and Oil
During May, Gold Bullion saw a decrease of 1.20%, largely influenced by the rise in US interest rates and subsequently, the US Dollar (USD). It’s important to understand that when these two factors increase simultaneously, as they often do, Gold—which is principally priced in USD—will typically depreciate. However, when valued in terms of the Australian Dollar, Great British Pounds, Euro, and Japanese Yen, Gold is hitting record highs. Its recent high standing in the USD, established earlier this year, is the only one it hasn’t managed to sustain.
In contrast, oil prices experienced a drastic plunge, with a substantial decrease of 10.70% in May. While a stronger USD—which oil is priced in—did have some effect, the primary driving force behind this collapse was the anticipated global economic slowdown and a consequent reduced demand for oil in economic production. Oil prices have now dipped by over 31% from their one-year peak. The influence of the post-Covid highs, amplified by the conflict in Ukraine, have now significantly receded, impacting the overall oil price trajectory.
Disclaimer
The information provided in this communication has been issued by Centrepoint Alliance Ltd and Ventura Investment Management Limited (AFSL 253045).
The information provided is general advice only has not taken into account your financial circumstances, needs or objectives. This publication should be viewed as an additional resource, not as your sole source of information. Where you are considering the acquisition, or possible acquisition, of a particular financial product, you should obtain a Product Disclosure for the relevant product before you make any decision to invest. Past performance does not necessarily indicate a financial product’s future performance. It is imperative that you seek advice from a registered professional financial adviser before making any investment decisions.
Whilst all care has been taken in the preparation of this material, no warranty is given in respect of the information provided and accordingly neither Centrepoint Alliance Ltd nor its related entities, guarantee the data or content contained herein to be accurate, complete or timely nor will they have any liability for its use or distribution.
